Directed Acyclic Graph showing nodes and arrows representing causal relationships

DAGs: Your Visual Roadmap to Understanding Cause and Effect

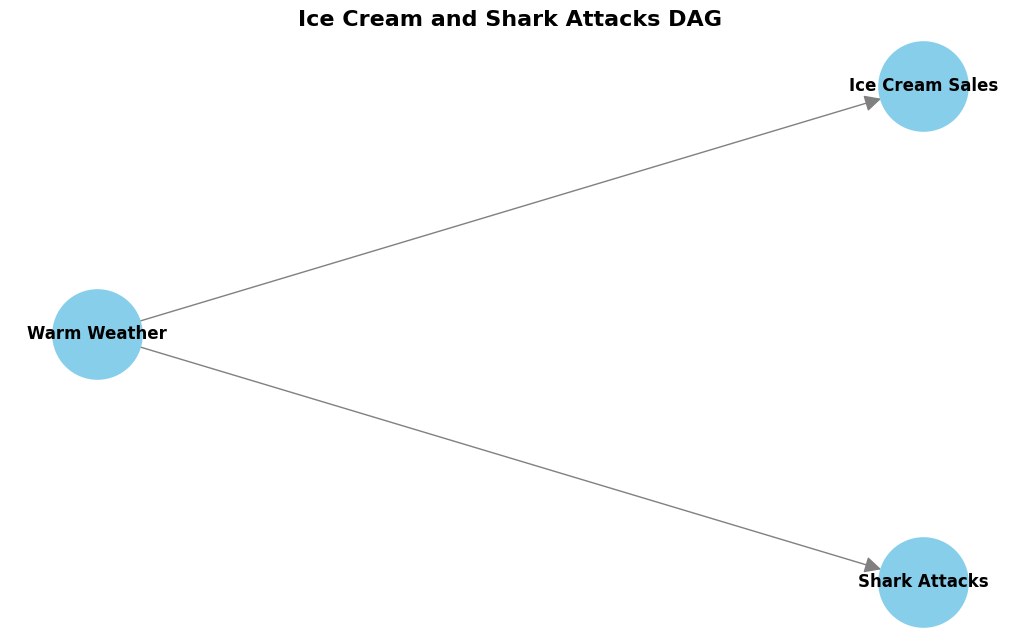
Learn how to use DAGs (Directed Acyclic Graphs) as visual roadmaps for understanding causality. This post explains what DAGs are, how to read them, build them, and use them to spot confounding - with practical Python examples.

October 2025 · Saeed Mehrang
Image representing cause and effect relationships or a question mark over data

The Quest for 'Why': Causal Inference, AGI, and the Limits of Pattern Recognition

This blog post introduces Causal Inference, highlighting the difference between correlation and causation and arguing that a true grasp of ‘why’ is necessary for the next evolution of AI.

October 2025 · Saeed Mehrang